Root Cause Analysis
In your company, have you ever taken the time to calculate the cost to the business of equipment failures? Most companies have not or, if they have, they do nothing about it.
A good rule of thumb
Taking the figure of £1,000 per hour as the total cost of downtime will give you enough incentive to take positive action. If you calculate the total downtime hours per year for each production line and then multiply by £1,000, the answer will be in six figures.
A recent example from the food industry can demonstrate this point
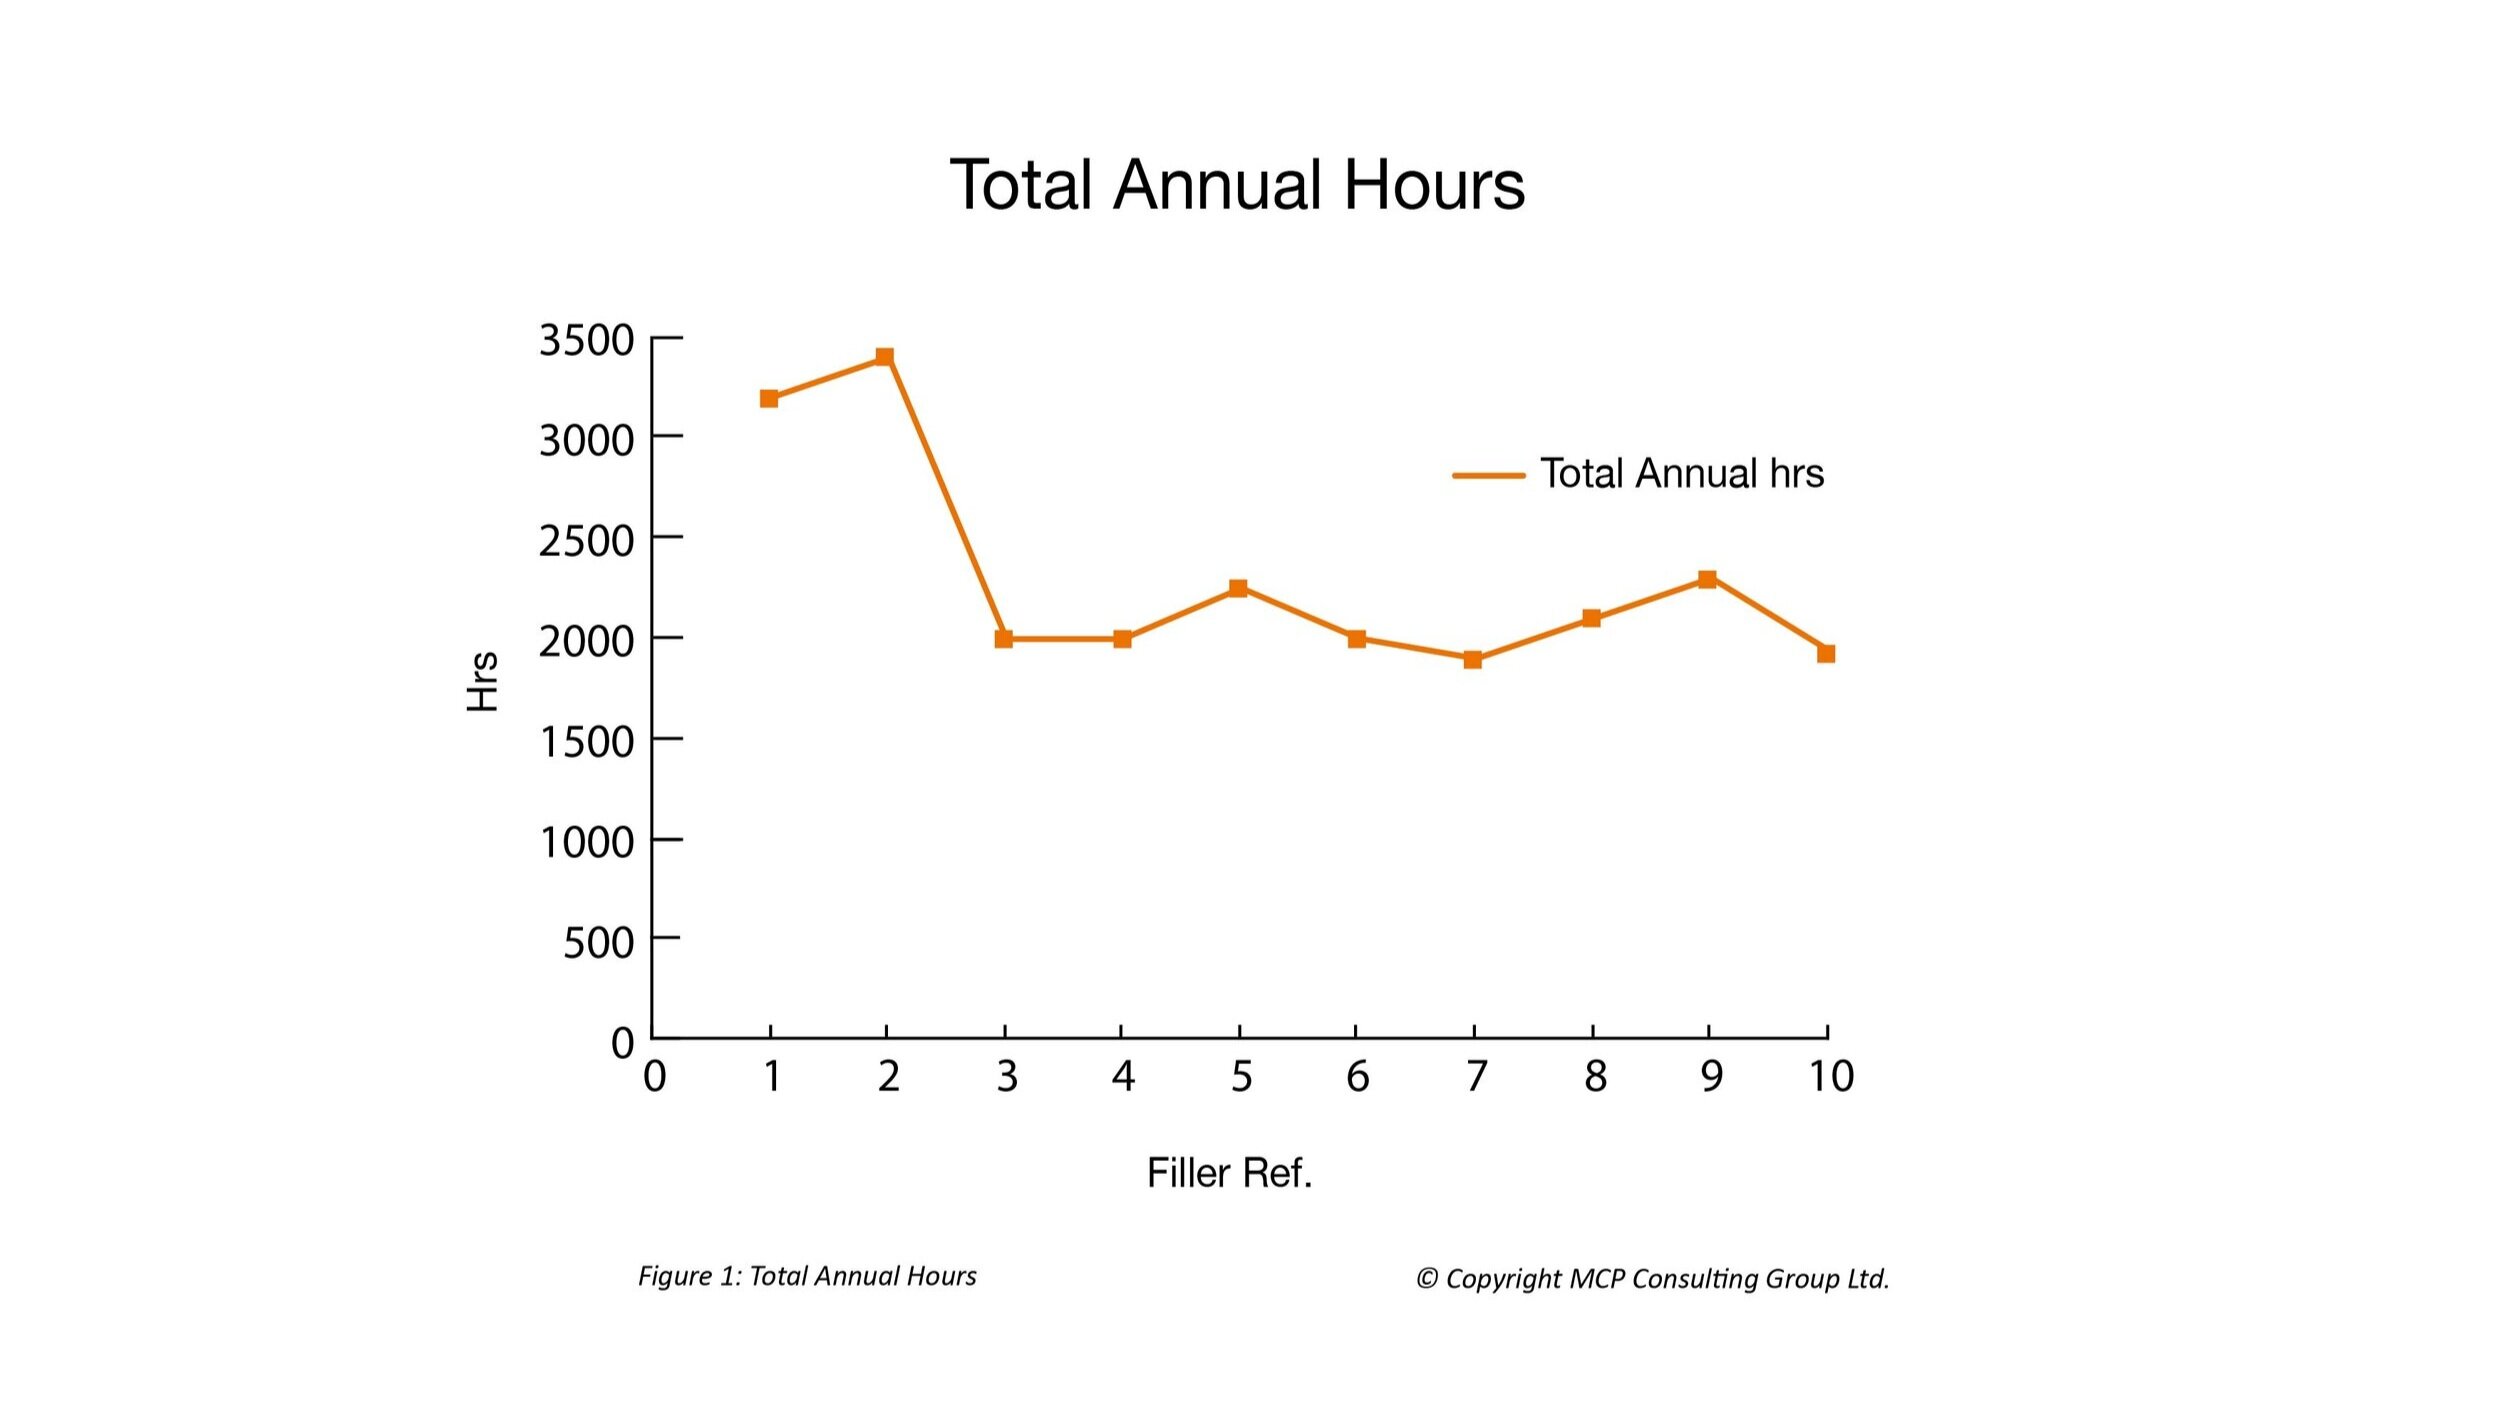
A food company operating 10 filling lines tracked the downtime due to all causes on each of the fillers for a period of 12 months; the results are shown in figure 1. The total annual lost output equated to 17,000 tons at a £1000 per tonne this equated to £17.0m.
Figure 1Using equipment performance data along with Root Cause Analysis improvements in performance and output can be achieved.
Case Study
In the above-mentioned food company, a twelve-week improvement project was set up involving maintenance and production staff with support from MCP. Analysis of existing maintenance data was followed by Root Cause Analysis (RCA) techniques to determine the causes of downtime and the root failure causes.
A deep dive analysis, which identified the lines with the biggest losses – lines 1 and 2 – an action was then taken to understand the reasons for the high losses on these two fillers and to identify any common issues across all the ten fillers. Further analysis of the remaining fillers followed.
The result was a 25% reduction in downtime hours, which on an annualised basis equated to approximately 5,000 hours of extra production output, equivalent to an extra 3,750 tonnes of product at a sales value of £3.75m.
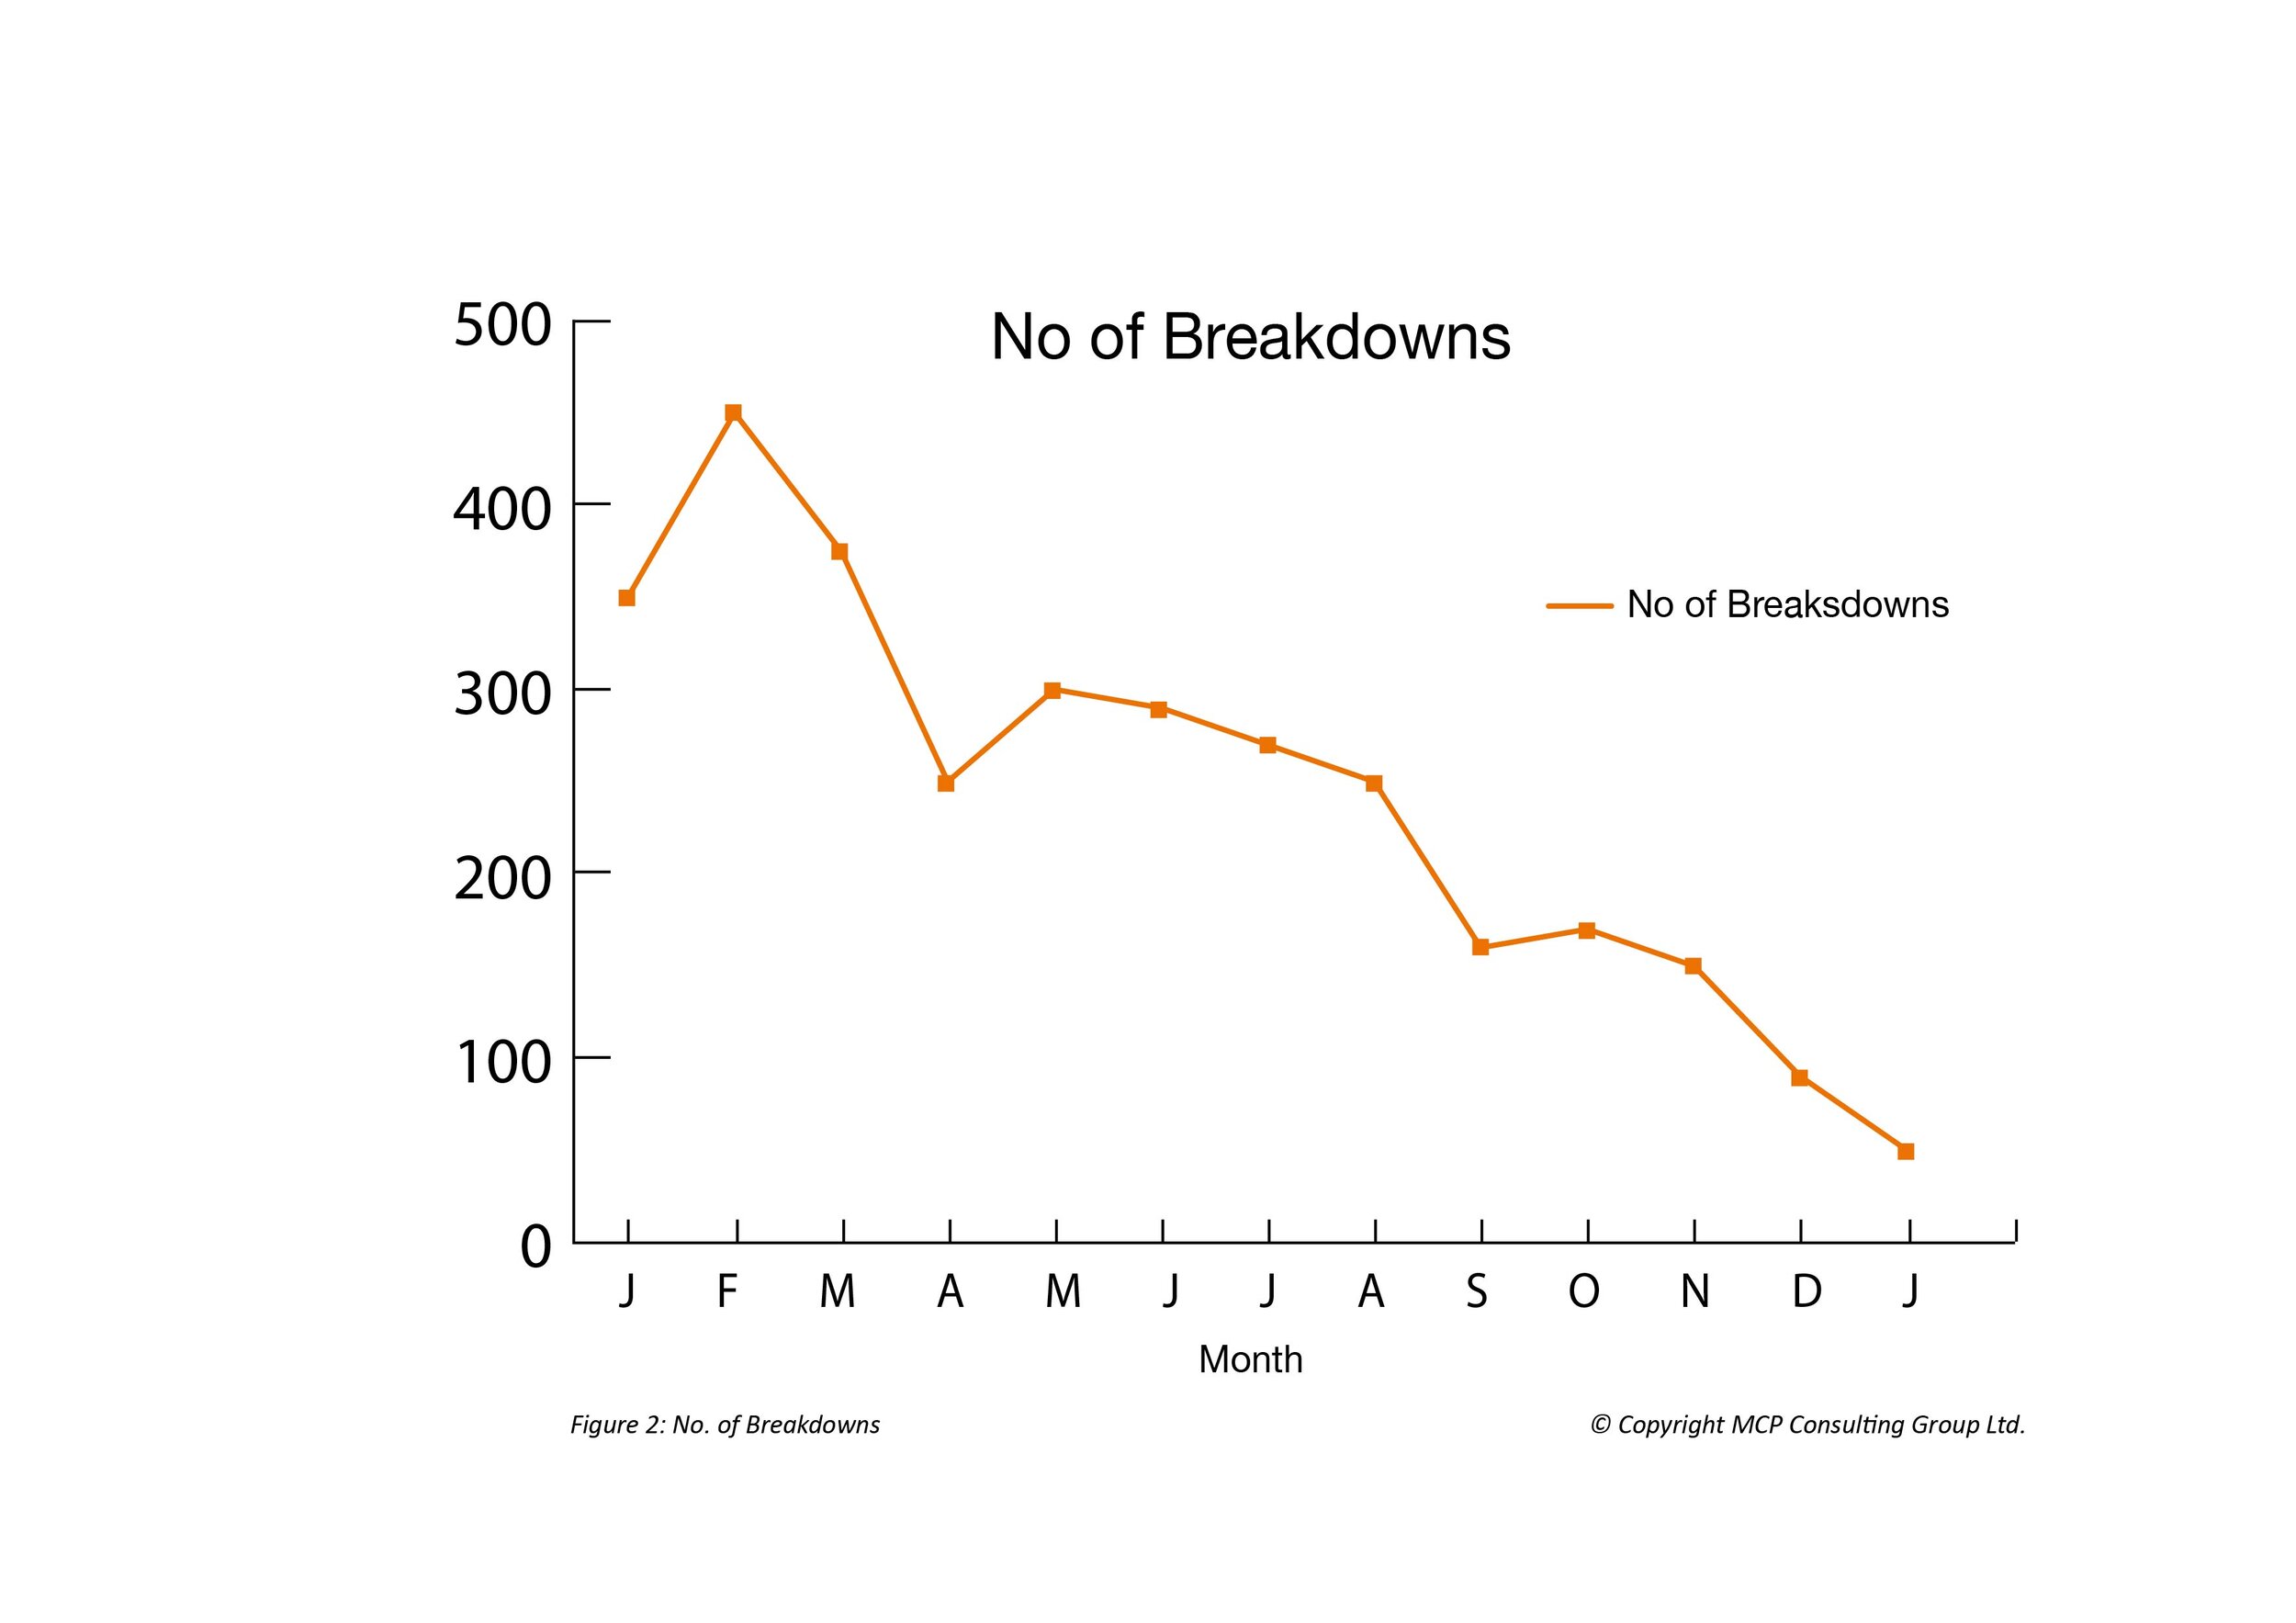
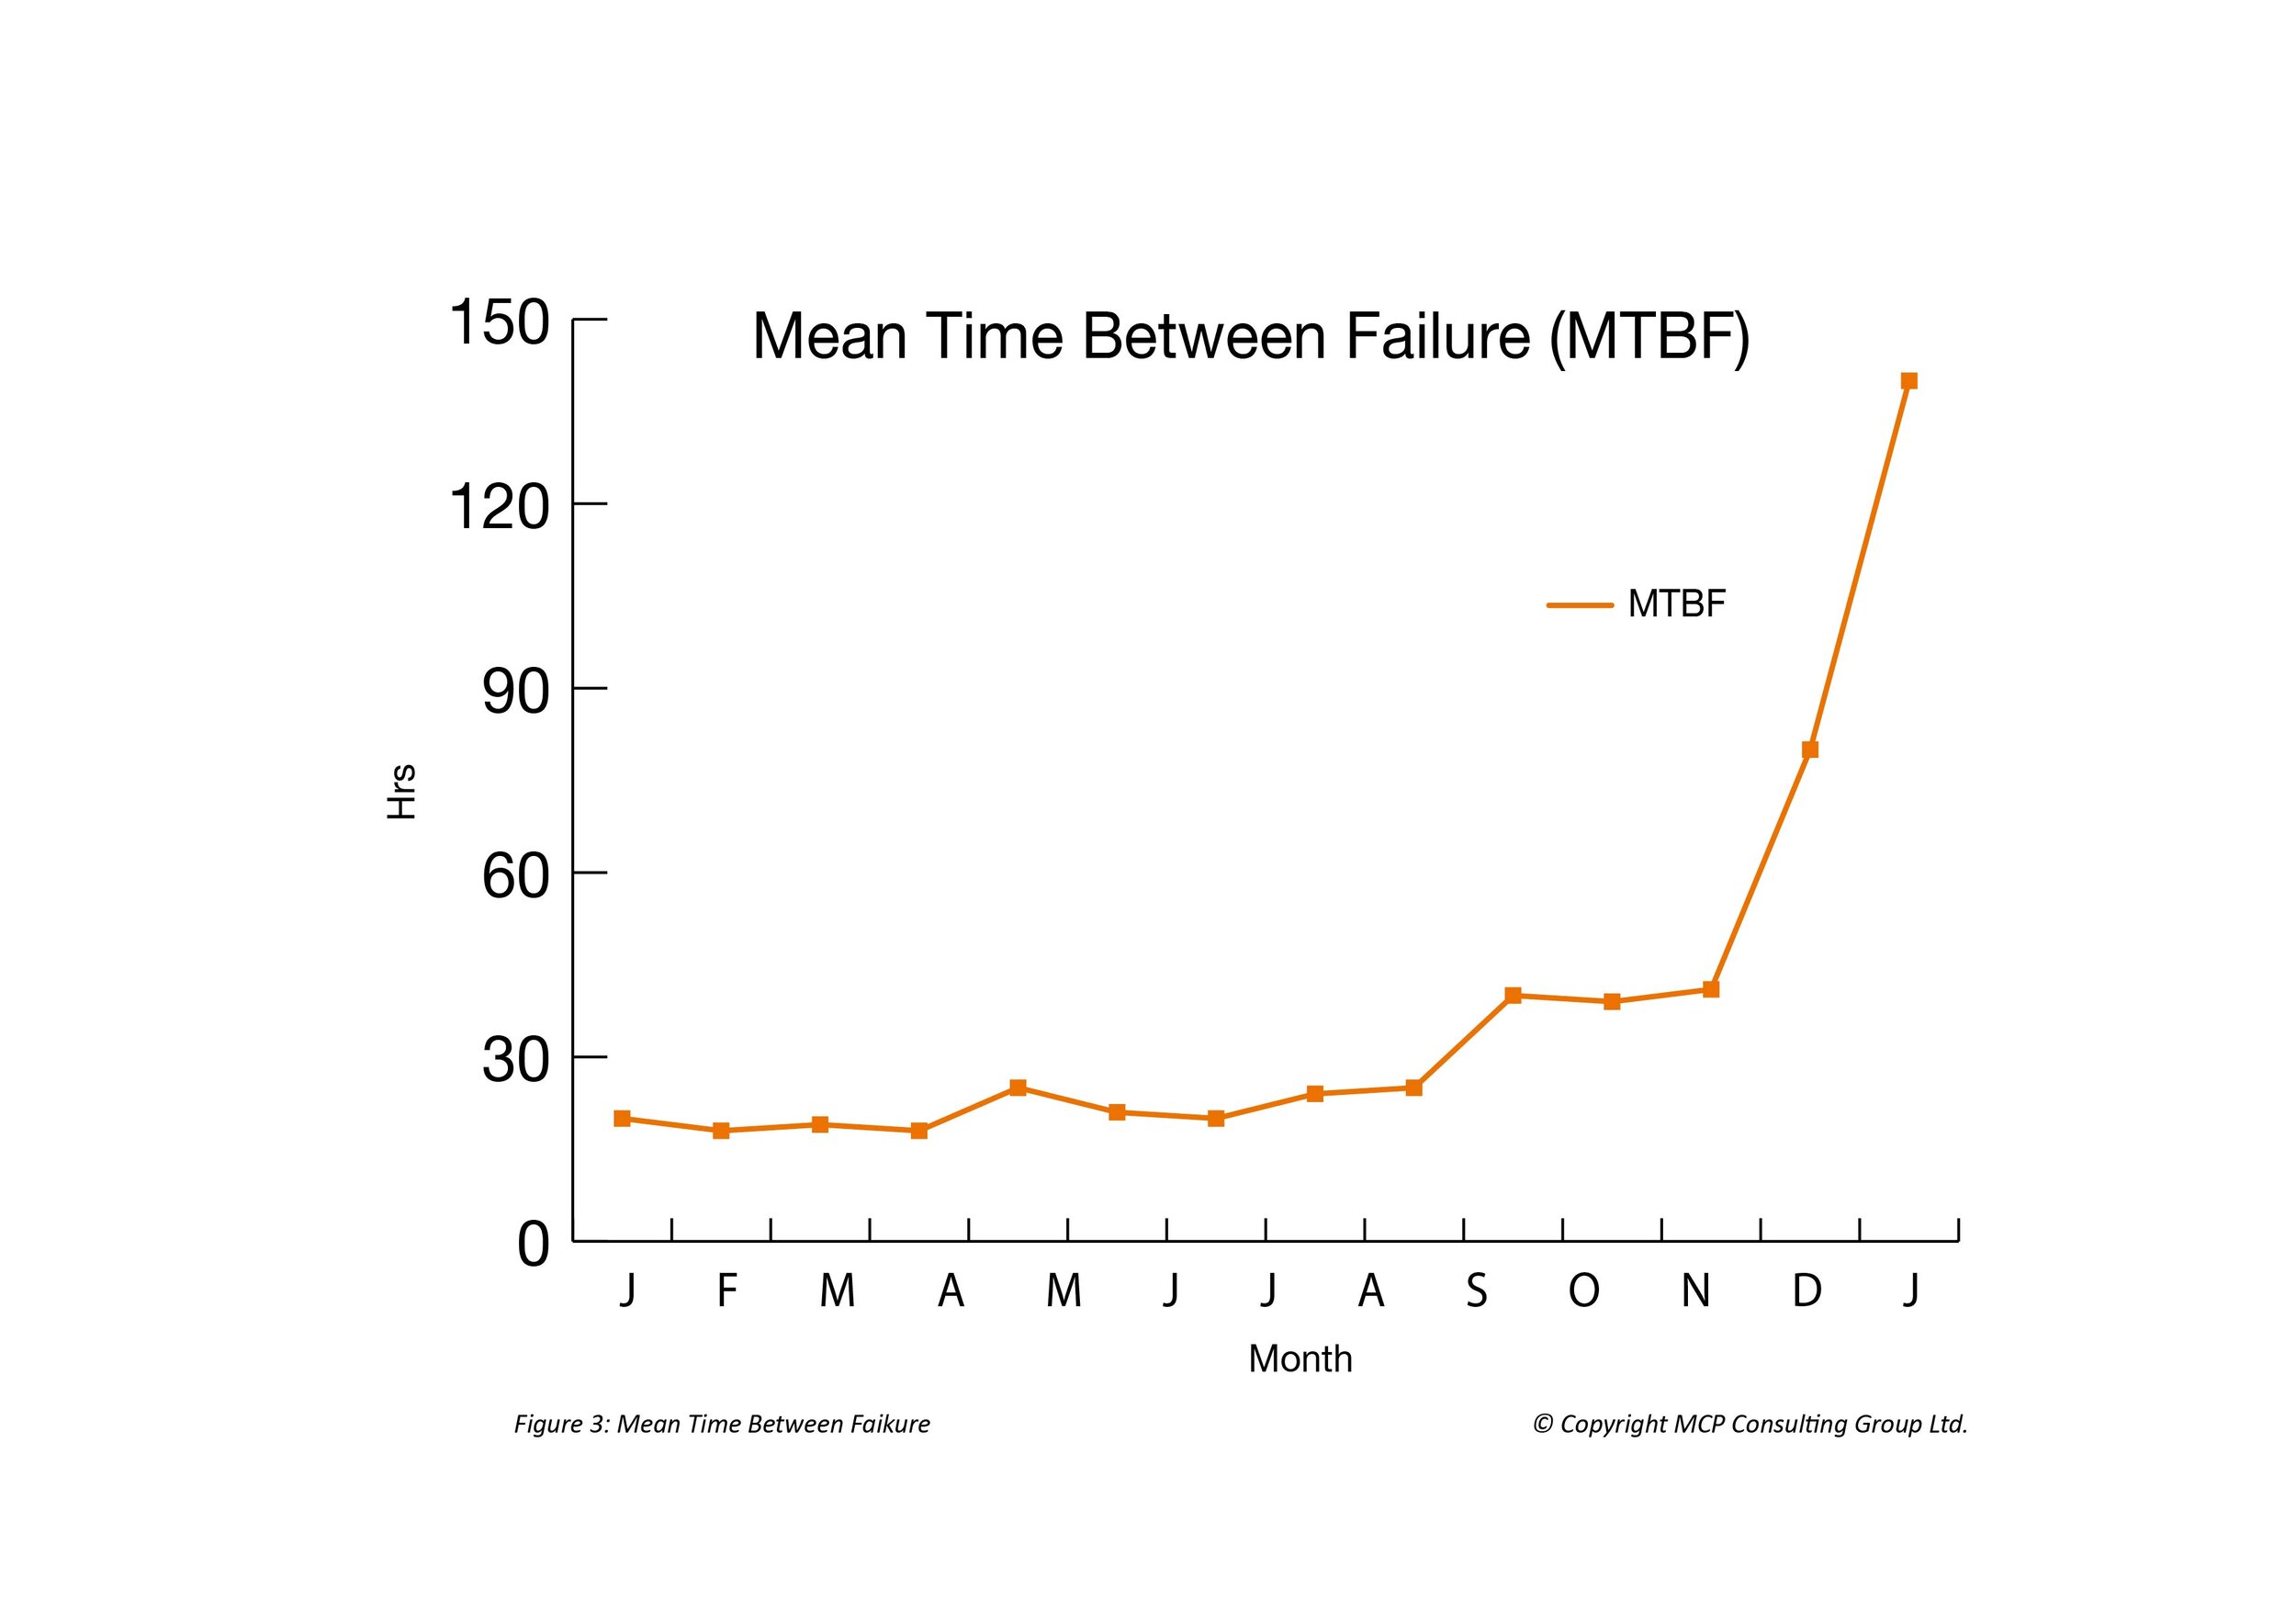
The number of breakdowns decreased over the full year as shown in figure 2; whilst the equipment reliability increased, shown in figure 3.
Figure 2Figure 3What is Root Cause Analysis (RCA)?
Before its current form as a widely used problem-solving method throughout all industries, RCA’s first appearance was in the field of engineering. The method is credited to the founder of Toyota Industries Co., Ltd., Sakichi Toyoda.
It is a process, which uses a variety of techniques to rapidly identify the true cause of any failure.
Root Cause Analysis in brief
RCA is typically used as a reactive method of identifying event(s) causes, revealing problems and solving them. The analysis is done after an event has occurred. Insights in RCA make it potentially useful as a pre-emptive method.
RCA is applied methodically to identify and correct the root causes of events, rather than to simply address the symptomatic result. Focusing correction on root causes has the goal of entirely preventing problem recurrence. Conversely, RCFA (Root Cause Failure Analysis) recognises that complete prevention of recurrence by one corrective action is not always possible.
Root cause analysis helps identify
What happened
How it happened, and
Why it happened
RCA should not be mistaken for Fault Diagnosis, which is the first level of investigation; for example, the line has stopped operating – the first step is to diagnose what has caused the line to stop; is it the motor, the gearbox, the power supply, a sensor, etc.
Problem-solving
The next step is to use RCA to determine what has caused the failure. The two stages are not necessarily activated consecutively. The priority has to be to get the line going again. The key to the RCA process is the structured analysis leading identifying root causes.
Problem-solving is key to this stage and the tools available to complete an RCA include Pareto Analysis, 5Whys, Fishbone Diagrams; Fault Tree Analysis; REM (Review of Existing Maintenance).
Just-do-it (JDI)
If a solution is immediately obvious, then a ‘Just-do-it’ (JDI) action may be appropriate. This should be a first challenge concerning what to do next in the decision making process.
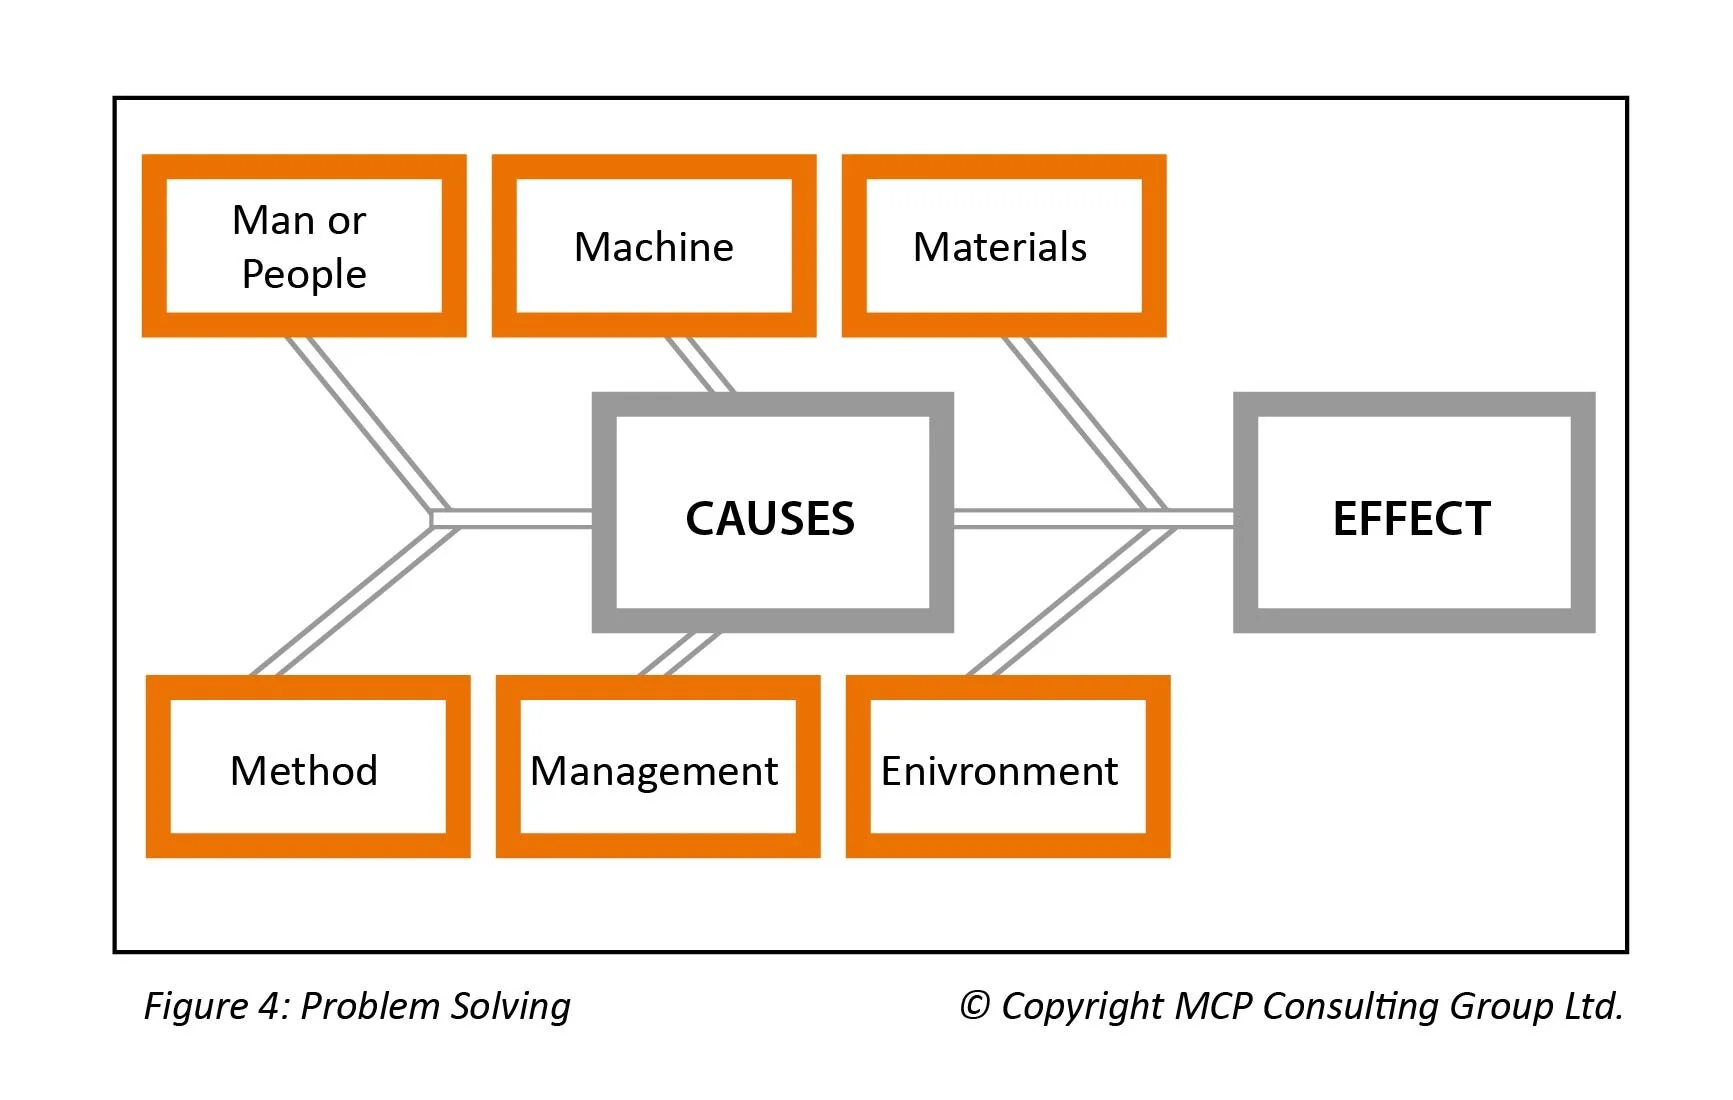
If no JDI is available, then the underlying causes can be determined using a cause-effect diagram (Figure 4) to structure the thinking involved.
Figure 4First introduced in 1968 by Kaoru Ishikawa in Japan, the 6 major causal elements that could contribute to an effect are collected in the diagram before failure analysis is conducted. The analysis is good at ensuring that all avenues have been explored.
There can be several potential causes and each one needs to be investigated more closely to dig down to the root of the problem.
5 Whys technique
For each cause identified, the proven 5Whys technique is often sufficient to uncover the root of the problem (Figure 5). It has been demonstrated that asking the question ‘why?’ five times in succession is an effective way of getting down to the root cause of events.
Figure 5Childish? Too simple?
This may seem too simple or superficial, but not according to world-class companies who use this initial discipline before referring to more complex techniques such as problem analysis models and, of course, 6Sigma.
Cause Mapping
Increasingly, a combination of cause and effect, and 5Whys has emerged as a process called ‘Cause Mapping’ (Figure 6).
Note the reversal of the direction of thinking from the Ishikawa ’cause-and-effect’ diagram. It is because the Japanese write from right to left and it easier for westerners to think left to right.
Figure 6Root Cause Analysis can also be used to analyse historical failures that are either one-time occurrences or frequently occurring. Quite often frequent failures are not noticed for a variety of reasons such as:
People on different shifts have to deal with the same failures but there is no process for reporting them
People accept failures as part of the job
There is no process for the analysis of the work records in the Computerised Maintenance Management System (CMMS) or the data is collected in such a way that does not allow for easy analysis and reporting
The solutions to the above issues are:
Establish a common process for reporting all failures including failure, cause and action codes
Establish a Failure Reporting and Corrective Action System (FRACAS)
Specify and make available the right management information required from your CMMS to identify both one-off and repetitive failures
Use the CMMS to identify the top ten faults
Put in place preventative actions to eliminate the failure occurring in the future as this will require a review of your PM (Preventative Maintenance) programme.
In short, root cause analysis training guides you in asking the right questions – without which you will be unlikely to get the right answer.
MCP provides on-site analysis and support to improve production performance and equipment reliability. In addition, MCP offers City & Guilds certified training in Root Cause Analysis, Fault Finding and Maintenance Optimisation.




Course Type | Continuous Improvement
Certificate | MCP Training Certificate
Only available as an on-site course